
1.3.1.3.13 Waveform Capture Function Usage Example
The waveform capture feature is a powerful tool allowing Core 0 to access the metrology samples. The data can be processed by the Demo Meter Application running on Core 0, or can be sent to an external device for analysis.
The waveform capture function is useful in two main scenarios:
- When the product is being developed it is an excellent engineering tool for analyzing the acquired data. The signals can be inspected to obtain more information about a hypothetical cross-talk or to assess how some critical sections of the electronic design (power supplies, communications modules, relays, switching devices, etc.) could be introducing noise in the metrology channels.
- At the release time, it allows new functionality to be included in the final product. Typical examples: waveform monitors, harmonic analysis of the captured data (FFT), etc.
Example: This is a simple exercise showing how to capture and process the samples being
acquired by a PIC32CXMTSH board:
- The input signal to be applied to
the board is a bi-phase signal (phases A and B) with the harmonic number 13
having 25% signal levels relative to the fundamental frequency. This is the
waveform being applied by the meter test bench:
Figure 1-127. Input Signal 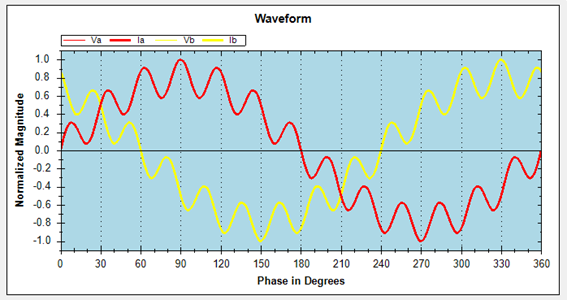
- When the input signal is applied,
the metrology library needs to be configured with the proper capture settings.
This can be done using the command console and writing the proper metrology
input registers. In this case, the capture will consider the voltage and current
channels for phases A and B, it will be a one-shot capture, 2 cycles for each
channel will be considered (960 samples at 16 ksps). The commands required for
this configuration are:
- DCW[45](00000F00)
- DCW[46](F00)
- DCW[45](80000F00)
- The data is available using the BUF command. It can be saved into a file.
- The data can be processed using
an external tool. Typical actions are:
- To plot the
waveforms:
Figure 1-128. Waveforms 
- To compute the FFT, to
check that the harmonic level is the expected one:
Figure 1-129. FFT Computation 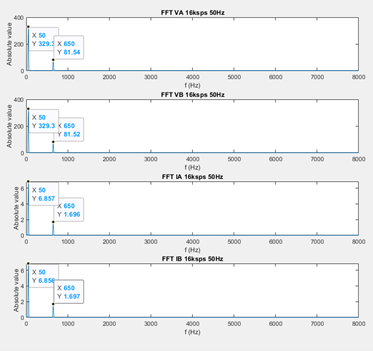
- To plot the
waveforms: