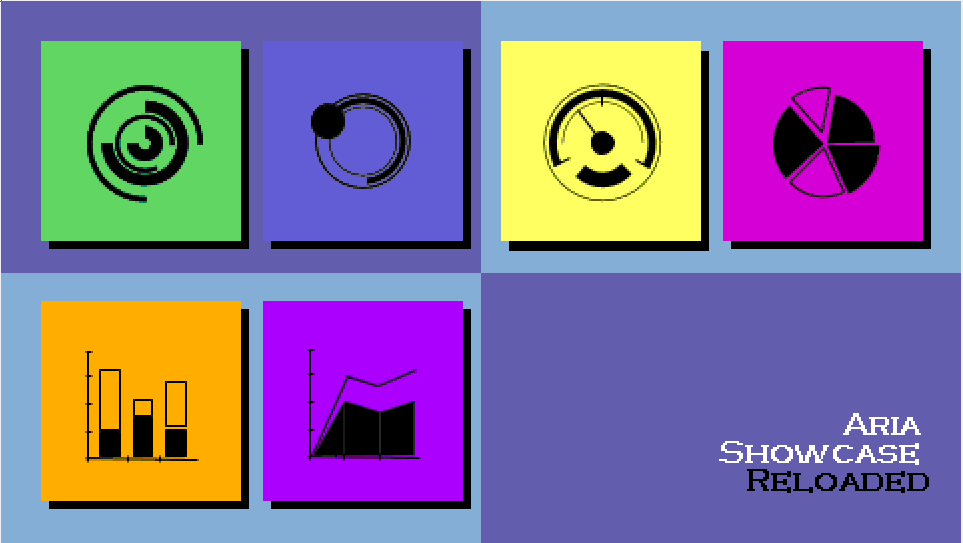
This application showcases the circular and graphing widgets such as: arc, circular slider, circular gauge, pie chart, bar graph, line graph.
- Arc – a primitive drawing widget that can be used to draw filled arcs or circles.
- Circular Slider – a circular widget that takes user input to set/show a value within a specified range.
- Circular Gauge – a circular widget that shows a value within a range using a needle and tick marks.
- Pie Chart – a graphing widget that shows data values as sectors in a circle.
- Bar Graph – a graphing widget that shows data values in categories using rectangular bars.
- Line Graph – a graphing widget that shows data values in categories using points and lines.
Each widget is demonstrated on a separate application screen. Touching the screen or an applicable widget button will show each widget change in form or value.
The application has Demo Mode enabled, and will run autonomously if no touch input is detected after 20 seconds.
Topics
|
Name |
Description |
|
This application runs on the SAM E70 Xplained Ultra Evaluation Kit using LCC software display controller to drive the High-Performance 4.3" WQVGA Display Module with maXTouch® Technology. |
MPLAB Harmony Graphics Suite Applications > Examples and Demonstrations > Aria Applications > aria_showcase_reloaded
|
MPLAB® Harmony Graphics Suite Applications
|