
In all configurations, the graphics library renders the widgets to the frame buffer(s), which is periodically refreshed to the display. The graphics library also processes user input via the touch screen and sends events to the application code which updates the widgets appropriately.
Since two 16-bit RGB565 frame buffers cannot fit into the internal device SRAM, this configuration uses two 8-bit buffers to support double-buffering. The 8-bit buffers contain the indices of 16-bit colors in a palette lookup table (CLUT). The graphics library renders the widgets by writing the index of a pixel color into the buffer. During a display line refresh, the LCC (low-cost controllerless) driver performs a palette lookup to convert the 8-bit indices to their 16-bit color equivalent for each line and then writes the line data to the display via DMA. Using 8-bit palettized buffers allows for double-buffering and eliminates tearing during rendering. On the other hand, the lookup table conversion requires extra processing time and reduces performance.
- Circular widgets – arc, circular slider, circular gauge
- Graphing widgets – pie chart, bar graph, line graph
- Timer HW and Timer System Service
- Image compression techniques using Run-Length Encoding
- Double-buffering using LUT (lookup-table) based frame buffers
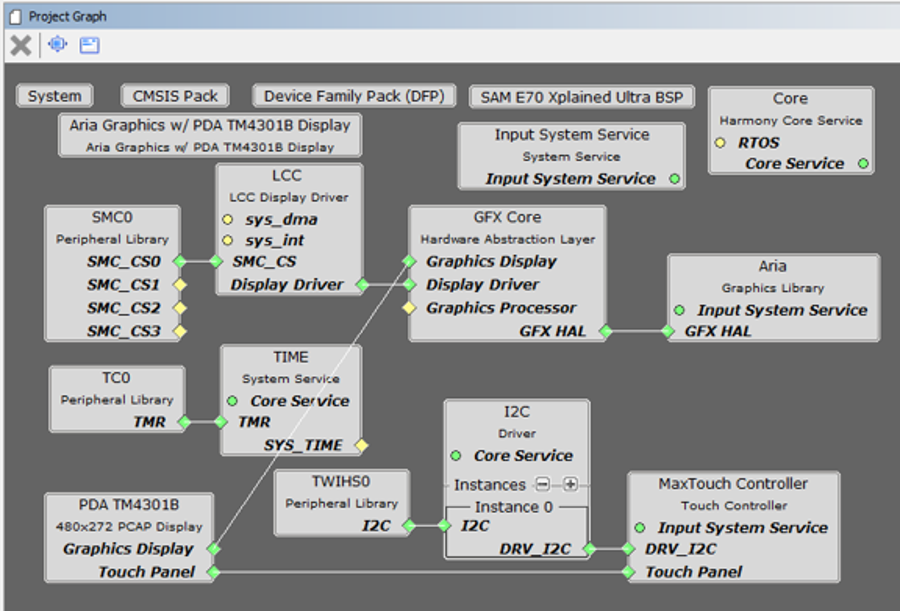
The Project Graph diagram shows the Harmony components that are included in this application. Lines between components are drawn to satisfy components that depend on a capability that another component provides.
Adding the “SAM E70 XPlained Ultra BSP”and the “Aria Graphics w/ PDA TM4301B Display” Graphic Template components into the project graph will automatically add the components needed for a graphics project and resolve their dependencies. It will also configure the pins needed to drive the external peripherals like the display and the touch controller.
Enable the global 8-bit color palette by selecting the Aria Graphics Library component:
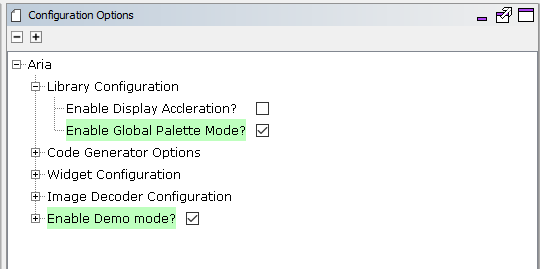
For the GFX Core component enable double buffering. (Global Palette Mode is enabled and grayed out since it is inherited from the Aria Graphics Library component.)

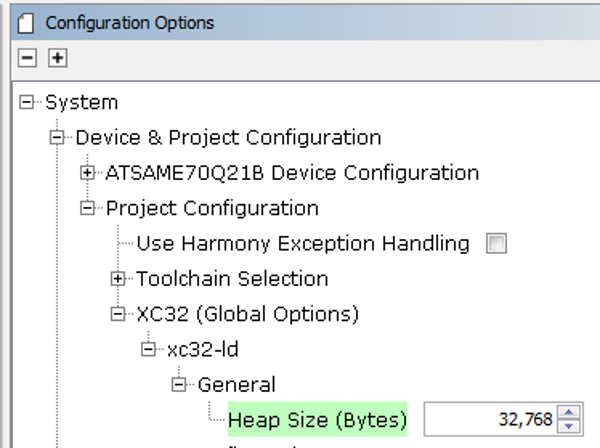
The heap size is set to 32768 bytes. This is done by setting the Device & Project Configuration > Project Configuration > XC32 (Global Options) xc32-ld > General > Heap Size option for the “System” component:
The parent directory for this application is gfx_apps/apps/aria_showcase_reloaded. To build this application, use MPLABX to open the gfx_apps/apps/aria_showcase_reloaded/firmware/aria_scr_e70_xu_tm4301b_lut8.X project file.
The following table lists configuration properties:
|
Project Name |
BSP Used |
Graphics Template Used |
Description |
|
aria_scr_e70_xu_tm4301b_lut8.X |
sam_e70_xplained_ultra |
Aria Graphics w/ PDA TM4301B Display |
SAM E70 Xplained Ultra board with PDA TM4301B 480x272 (WQVGA) Display |
 Important! Important! |
This application may contain custom code that is marked by the comments // START OF CUSTOM CODE ... and // END OF CUSTOM CODE. When using the MPLAB Harmony Configurator to regenerate the application code, use the "ALL" merging strategy and do not remove or replace the custom code. |
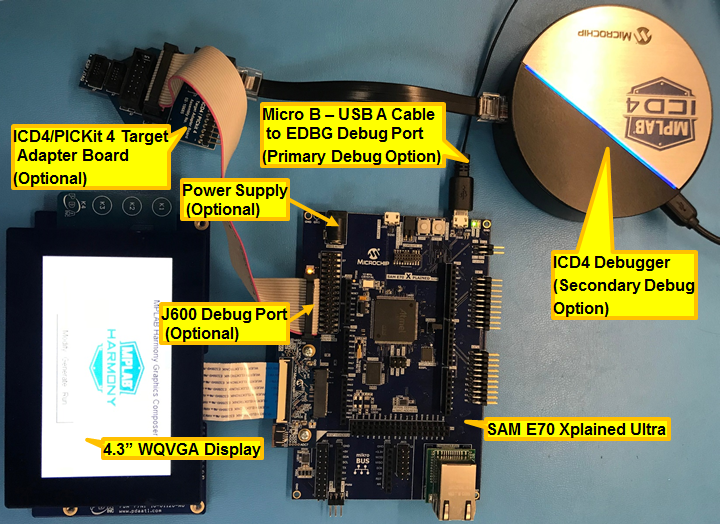
There are two programming options. The primary option is the Micro B Embedded Debugger (EDBG) port. Power to the board can also be supplied via this connection. The secondary option is via the ICD4 debugger with the ICD4/PICKit 4 Target Adapter Board (Power has to be provided from power supply in this alternative setup).
The image below shows both the EDBG and the ICD4 connection options:
Configuring the 4.3” WQVGA Display requires disconnecting the ribbon cable that connects the display to the interposer board.

First, release the ribbon cable from the interposer board. Next, release the black clamp on the E70’s J2 connector and turn the display over. Finally, insert the ribbon cable into J2 and close the clamp.

The board and display are powered by a Micro B – USB A cable from PC to the “Debug USB” port on the E70 board. The ICD4 Debugger and ICD4/PICKit4 Adapter Board are connected as shown above.
On start-up, the application will display a splash screen.

After the splash screen completes, the Main Menu will display.
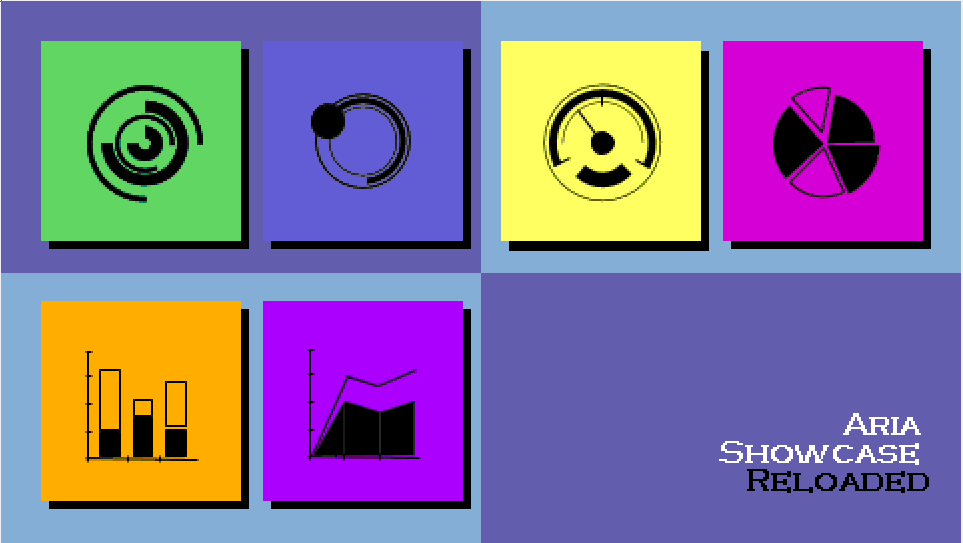
The Main Menu buttons operate as follows:
|
Button |
Description |
 |
Arc Demo Button – Opens the Arc Widget Demonstration Screen. |
 |
Circular Slider Demo Button – Opens the Circular Slider Demonstration Screen. |
 |
Circular Gauge Demo Button – Opens the Circular Gauge Demonstration Screen. |
 |
Pie Chart Demo Button – Opens the Pie Chart Demonstration Screen. |
 |
Bar Graph Demo Button – Opens the Bar Graph Demonstration Screen |
 |
Line Graph Demo Button – Opens the Line Graph Demonstration Screen |
Touching one of the buttons above opens the corresponding widget demonstration screen. Each demonstration screen will have the following buttons:
|
Button |
Description |
 |
Home Button – Opens the Main Menu Screen |
 |
Next Button – Opens the Next Demonstration Screen |
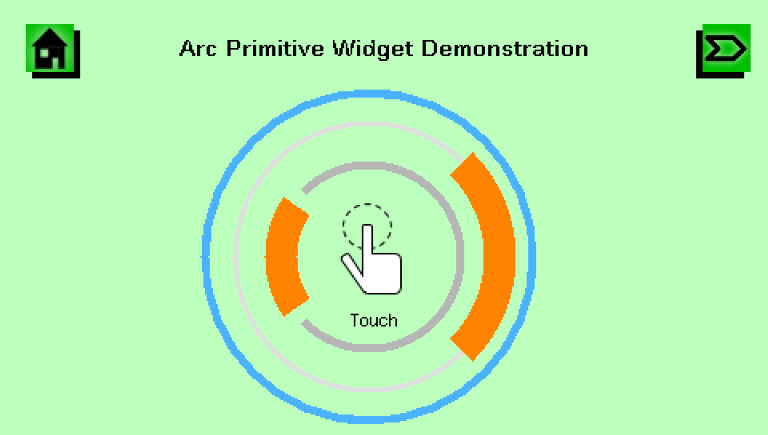
Touching the Arc Demo Button on the Main Menu Screen brings up the Arc Widget Demonstration Screen, as shown in the following figure. Touching the screen will show animated, rotating concentric arcs and circles. This demonstrates the graphics library’s ability to draw arcs of varying thickness, angles and colors.
Touching the Circular Slider Button on the Main Menu or the Next Button on the Arc Widget Demonstration Screen will open the Circular Slider Demonstration Screen, as shown below. The screen contains a Circular Slider widget on the right, and Circular Progress Bar widget on the left. The Circular Progress Bar widget is a form of the Circular Slider widget with no button and does not respond to touch input.
Touching and moving the button on the Circular Slider widget clockwise or counter-clockwise, will decrease or increase its value. This value is assigned to the Circular Progress Bar widget, which updates based on the set value, and to a label widget inside it to show the numeric value.

Touching the Circular Gauge button on the Main Menu screen or the Next button on the Circular Slider Demonstration screen opens the Circular Gauge Demo Screen, as shown in the following figure. This simulates a vehicle dashboard using two Circular Gauge widgets as tachometer and speedometer. Touching the screen increases the value of the two gauges.

Touching the Pie Chart button on the Main Menu or the Next button on the Circular Gauge Widget Demonstration screen opens the Pie Chart Demonstration Screen, as shown in the following figure. Touching a slice on the Pie Chart widget will change the slice’s radius and offset from the center.

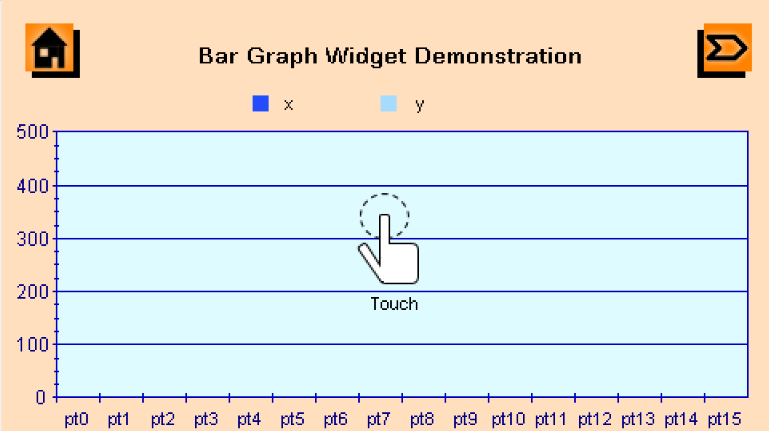
Touching the Bar Graph Button on the Main Menu, or the Next Button on the Pie Chart Demonstration Screen will open the Bar Graph Demonstration Screen, as shown in the following figure. Touching the screen will plot the x and y coordinates of the touch point in the bar graph widget.
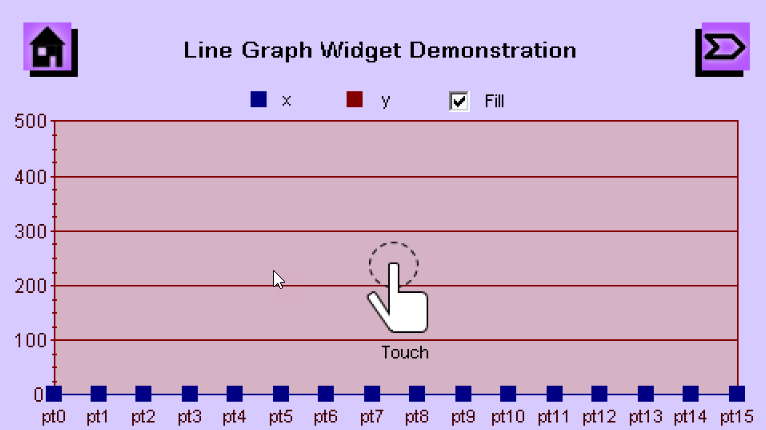
Touching the Line Graph Button on the Main Menu or the Next Button on the Bar Graph Demonstration Screen will open the Line Graph Demonstration Screen, as shown in the following figure. Touching the screen will plot the x and y coordinates of the touch points in the line graph widget.
|
MPLAB® Harmony Graphics Suite Applications
|