This window shows the evolution of the network as seen by the sniffer. It plots the number of active nodes and switches on the network versus time, and is useful to detect problems of stability on the PLC network. Use the mouse wheel to zoom in and out.
Figure 1. Nodes/Switches Plot View
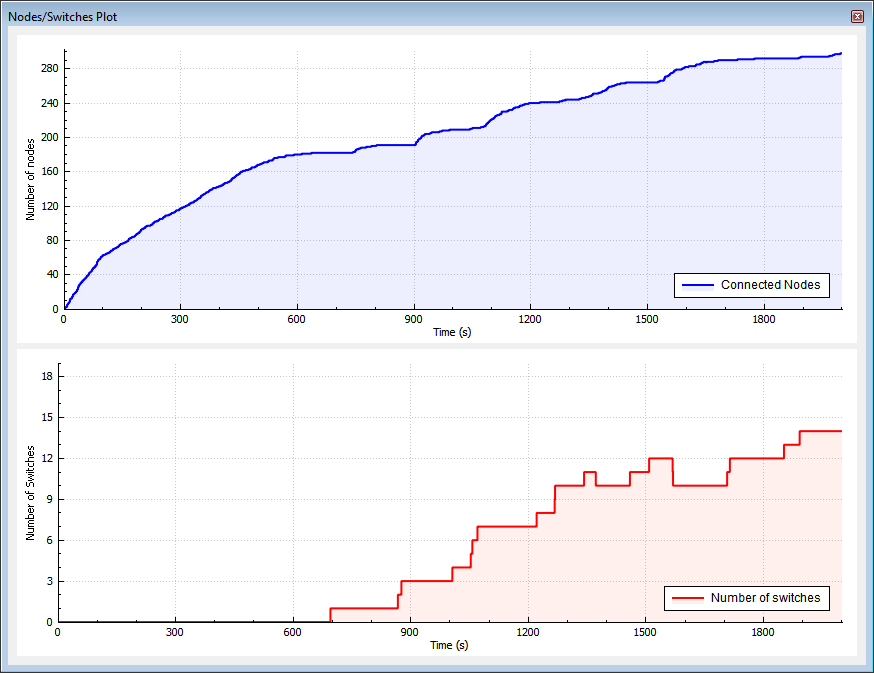
Figure 1 shows the network structure of a PLC network and how it has evolved after a reboot of the Base Node.
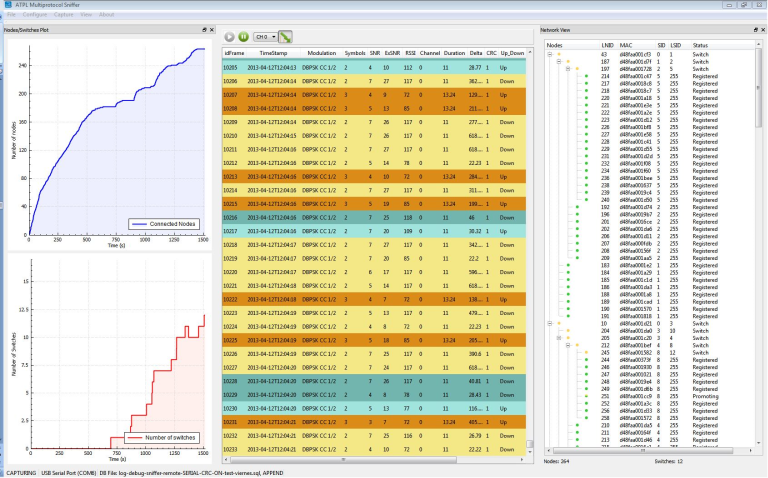
Figure 2. PLC Sniffer Showing the Network Structure and Node/Switch Plot
View