
In this configuration, a 16-bit RGB565 frame buffer is stored in internal SRAM. Due to the limited size of the internal SRAM, only a single frame buffer can be used which can cause tearing to be visible as the GFX library draws on the screen. These configurations use the Low-Cost Controller-less (LCC) display driver to manage the DMA that transfers the framebuffer contents to the display.
- Low-Cost Controllerless (LCC) Graphics driver on the SAM E70 device
- Language localization in English, Chinese Simplified, and Spanish[add link to (see MPLAB Harmony Graphics Library Help> MPLAB Harmony Graphics Composer User’s Guide > Graphics Composer Window User Interface > Widget Tool Box Panel)
- Image compression techniques using Run-Length Encoding and JPEG (see Enabling Demo Mode in a MPLAB Harmony Graphics Application
- Run-time JPEG decoding
- UTF-8 character font support (see MPLAB Harmony Graphics Library Help> MPLAB Harmony Graphics Composer User’s Guide > Graphics Composer Window User Interface > Font Assets)
- Button Widget
- Image Widget
- Bar Graph Widget
- Line Graph Widget
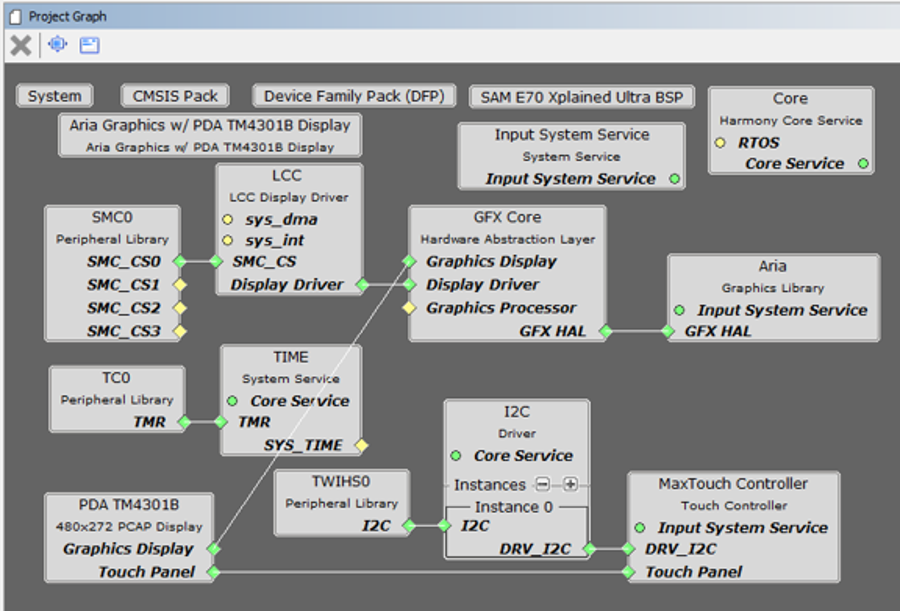
The Project Graph diagram shows the Harmony components that are included in this application. Lines between components are drawn to satisfy components that depend on a capability that another component provides.
Adding the “SAM E70 XPlained Ultra BSP”and the “Aria Graphics w/ PDA TMA4301B Display” Graphics Template components into the project graph will automatically add the components needed for a graphics project and resolve their dependencies. It will also configure the pins needed to drive the external peripherals like the display and the touch controller.
The parent directory for this application is gfx_apps/apps/aria_weather_forecast. To build this application, use MPLABX IDE to open the gfx_apps/apps/aria_weather_forecast/firmware/aria_wf_e70_xu_tm4301b.X project file.
The following table lists configuration properties:
|
Project Name |
BSP Used |
Graphics Template Used |
Description |
|
aria_wf_e70_xu_tm4301b.X |
sam_e70_xplained_ultra |
Aria Graphics w/ PDA TM4301B Display |
SAM E70 Xplained Ultra board with PDA TM4301B 480x272 (WQVGA) Display |
 Important! Important! |
This application may contain custom code that is marked by the comments // START OF CUSTOM CODE ... and // END OF CUSTOM CODE. If you use the MPLAB Harmony Configurator to regenerate the application code, use the "ALL" merging strategy and do not remove or replace the custom code. |
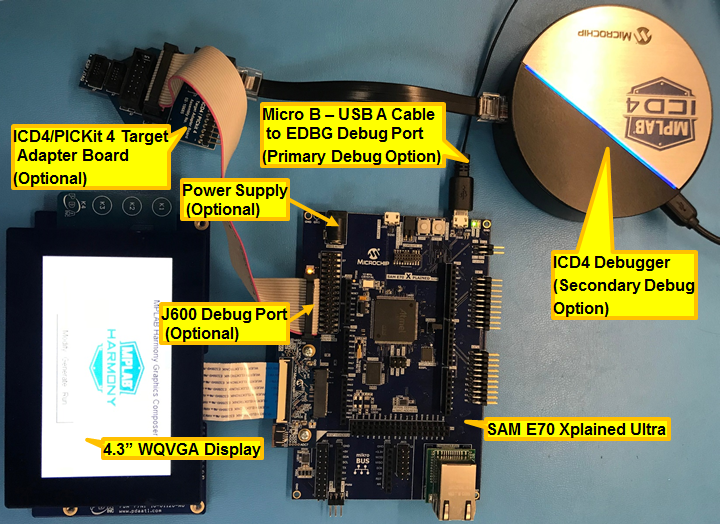
There are two programming options. The primary option is the Micro B Embedded Debugger (EDBG) port. Power to the board can also be supplied via this connection. The secondary option is via the ICD4 debugger with the ICD4/PICKit 4 Target Adapter Board (Power has to be provided from power supply in this alternative setup).
The image below shows both the EDBG and the ICD4 connection options:
Configuring the 4.3” WQVGA Display requires disconnecting the ribbon cable that connects the display to the interposer board.

First, release the ribbon cable from the interposer board. Next, release the black clamp on the E70’s J2 connector and turn the display over. Finally, insert the ribbon cable into J2 and close the clamp.

The board and display are powered by a Micro B – USB A cable from PC to the “Debug USB” port on the E70 board. The ICD4 Debugger and ICD4/PICKit4 Adapter Board are connected as shown above.
When power-on is successful, the demonstration will display an animated splash screen:

The next screen after boot-up shows Los Angeles (LA) daily weather:
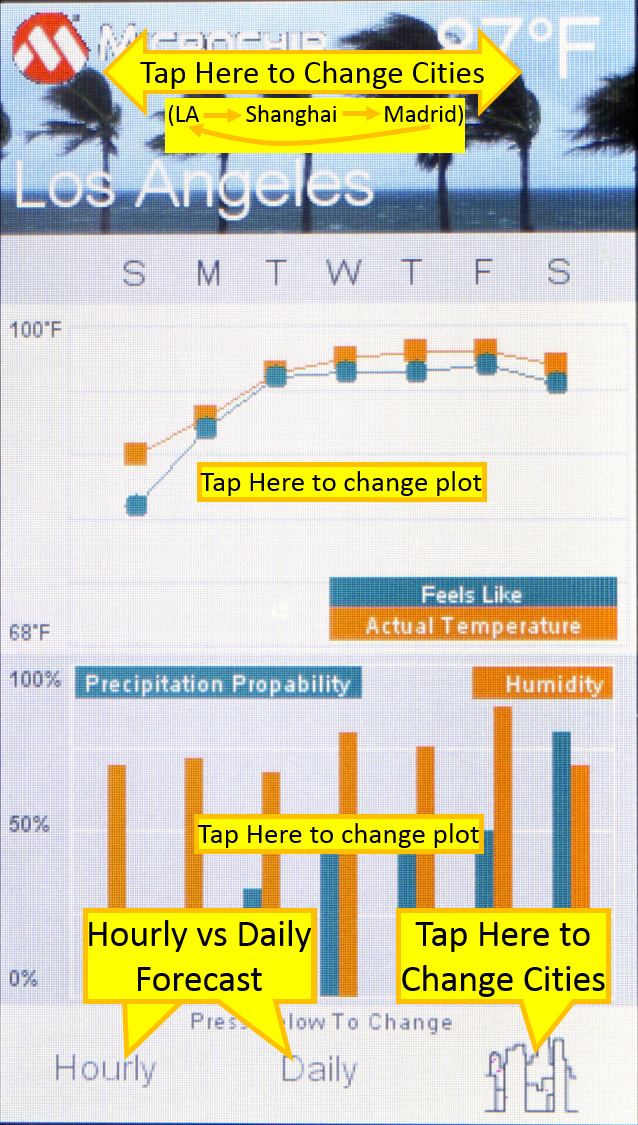
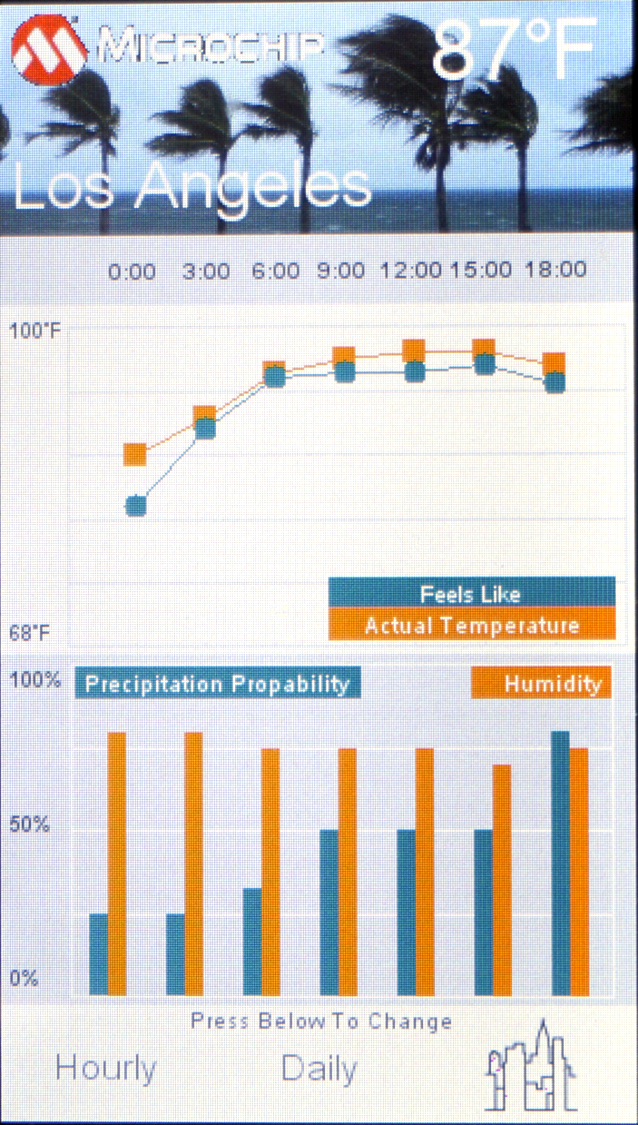
A tap at the top or at the lower right button (city graphic) changes from LA to China to Madrid and back to LA with each touch. Buttons on the bottom of the display changes the forecast between daily and hourly. The same change can be accomplished by tapping the center of the plots. Here is the LA hourly forecast display:
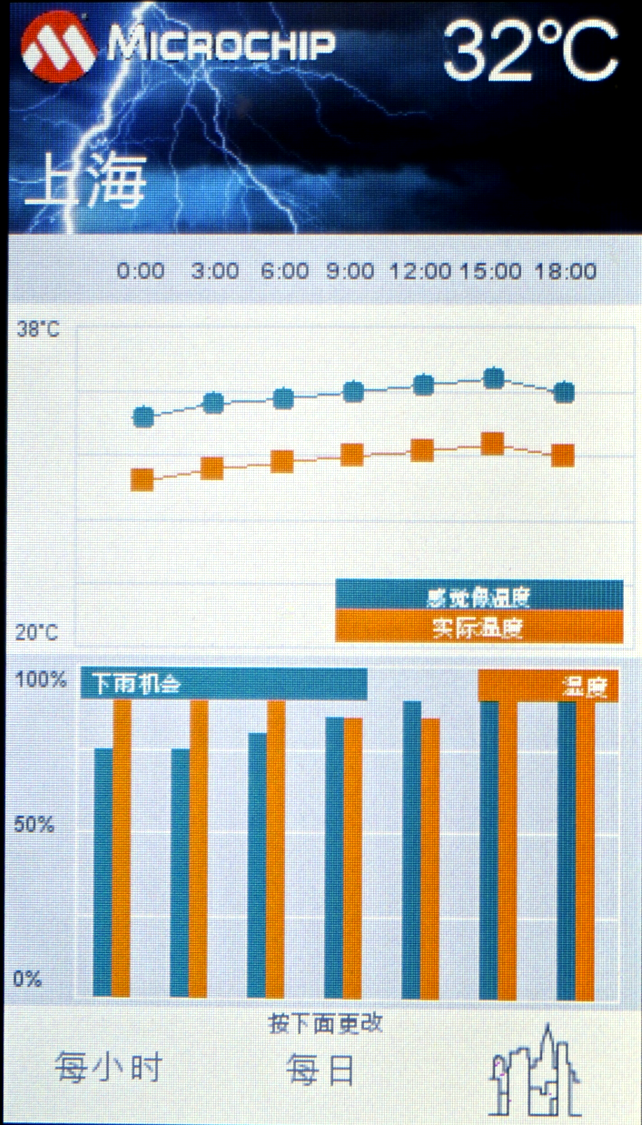
The Shanghai forecast display is in Chinese:
The Madrid forecast is in Spanish:

|
MPLAB® Harmony Graphics Suite Applications
|